Modern browsers are some of the most complicated programs ever written. For example, the main Firefox library on my system is over 130Mbytes. Doing 130MB of IO poorly can be quite a performance hit, even with SSDs! :).
Few people seem to understand how memory-mapped IO works. There are no pre-canned tools to observe it on Linux, thus even even fewer know how to observe it. Years ago, when I was working on Firefox startup performance, I discovered that libraries were loaded backwards (blog1, blog2, paper, GCC bug) on Linux. Figuring this out was super-painful, involved learning SystemTap and a setting up a just-right kernel with headers and symbols.
I decided to use above example to investigate solving this problem using modern EBPF. Noticed that there wasn’t any bpf that I could google for tracing mmap-IO. This is now fun and somewhat easy and is documented in github.
Theory
Linux libraries reside in files on disk. Dynamic library loader calls open() and mmap() to make certain parts of those libraries executable. mmap() lets one treat files as memory. Page-faults are the hardware mechanism that pauses program execution and fills in relevant data when mmaped disk is accessed as memory. In addition to memory mapping, in order for libraries to become executable pointers get adjusted, various callbacks get called to initialize the libraries (eg code to initilize global variables). Combination of initializing library and running code within in it causes some or all of the library to be loaded from disk.
EBPF lets one inject hooks into various parts of kernel and userspace. bpftrace is the toolchain for that. Here I use bpftrace to trace open(), mmap() and page-faults, then reverse-engineer the file mapping via bit of python in process.py.
Practice:
-
Install bpftrace with
sudo apt-get install -y bpftrace -
Find the relevant hooks with
sudo bpftrace -l '*syscalls*mmap*' -v. -
Run the analysis script with
sudo bpftrace mmap_pagefault_snoop.bt > faults.py(My script in https://github.com/tarasglek/bpftrace_pagefaults/tree/main/page_fault_user). In another terminal startfirefoxcommand. This generates pseudo-python function call of the IO trace that we can use to analyze data. -
Post-process, with something like
grep firefox-60792 faults.py | ./process.py | grep libxul.so |cut -d\ -f2 > /tmp/xul.csv.firefox-60792is the first Firefox pid that ran during my trace.process.pymatches up open(), mmap() syscalls with following page-faults such that we can figure out which offset in the mmaped-file was read.grep libxul.so+cutcommand dumps the data so we can graph in a spreadsheet. -
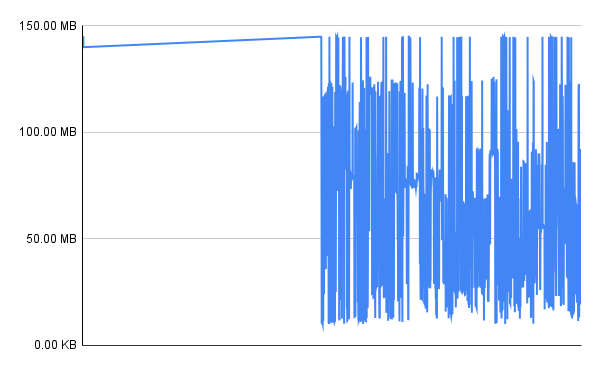
Post-process results a little, graph the results as a time series (see libxul.ods in assets dir).

-
Observe that the first part of the library is loaded sequentially(eg, from lower addresses to higher ones). This is likely the C++ static initializers.
Conclusion
Overall the IO pattern looks good: the toolchain bug I discovered has stayed fixed! One can see that the whole-program-compilation optimization in paper above is not present. I did this example on Ubuntu, suspect the picture looks different on Fedora due to LTO.
Limitations + Next Steps
-
We can trace mmap() syscalls for loading libraries, but there isn’t an mmap syscall when the initial executable gets mapped by Linux(happens as part of exec syscall, need to trace something else for that?). This can also be worked-around by parsing
/proc/#pid#/smaps. -
This doesn’t actually trace how the pages are loaded from disk. We’d have to add more ebpf tracepoints to better understand file IO. Eg we are paging in 4KB increments on x86, but Linux ammortizes some of the away by doing IO in read-ahead chunks of some multiple of that. This would be a fun follow-up project.
-
Had to do this on x86 as my arm64 VM is missing the
tracepoint:exceptions:page_fault_userand all of the otherexception:tracepoints. What the hell, why? -
Would be cool to include this sort of tooling as part of CI/CD to track mmap behavior.
-
This project shows the page-fault pattern during library loads. Checkout a complimentary parse_smaps util for analyzing memory footprint of mmaped files.